VG-relations
Visual Genome Relationship Visualization
Check it out here!
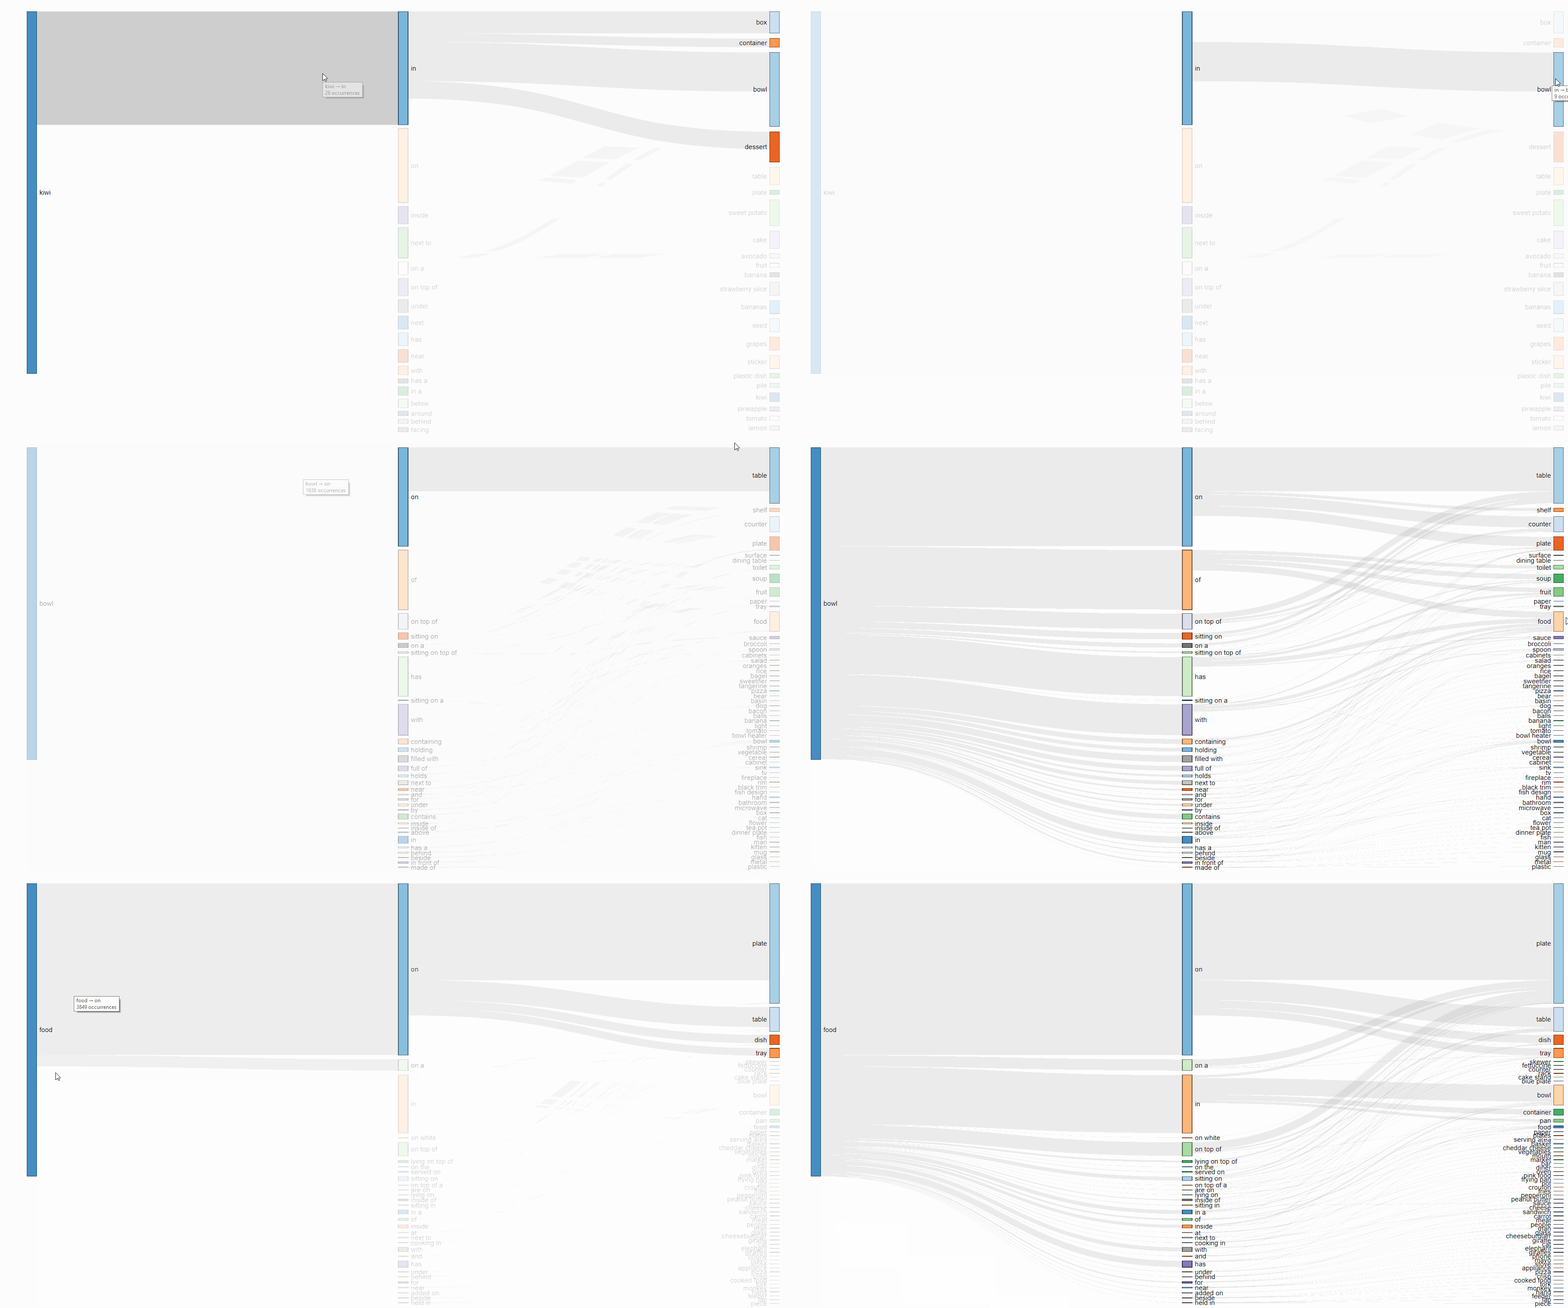
This is a tool for visualizing the frequency of object relationships in the Visual Genome dataset, a miniproject I made during my research internship with Ranjay Krishna at Stanford Vision and Learning.
The data format I use and its associated visualization is interesting to me because it suggests a potential way of imbuing computer vision algorithms with a form of common sense. For example, ‘what kinds of objects usually contain food? → bowls, plates, table’. This idea is also explored in Neural Motifs: Scene Graph Parsing with Global Context by Zellers et al.

Built with this d3 Sankey diagram library.
Navigation
Type an item into the search bar and hit submit to see relations in which the item was the subject.
From there, click on any object node to see relationships in which that object was the subject.
Additionally, click on a subject → relation link to narrow your focus to that relation and show additional objects.
If you found this useful or interesting, feel free to extend the visualization with new functionality, or use the processed data in another interesting way!
Data Processing
I tallied up all the relations in all the images in Visual Genome into this JSON format:
{
    "subject": {
        "relation": { "object": occurrences }
    }
}
Example:
{
    "person": {
        "wears": { "backpack": 12, "hat": 10 },
        "eats": { "pizza": 9 }
    },
    "plate": {
        "on": { "table": 5, "placemat": 3 }
    }
}
Installation
Clone or download the repository.
Open explorer.html in your web browser of choice (I used Chrome).
If you’re curious about how I processed the Visual Genome Relationship Data, check out scripts/count_relations.py.